
Research · Dec 2024 · CS 579 · team project
VoterInsight
An end-to-end forecast of turnout and results in Illinois's 4th Congressional District, from the map through the models.
VoterInsight media, 1 items. Use the arrow keys to move.
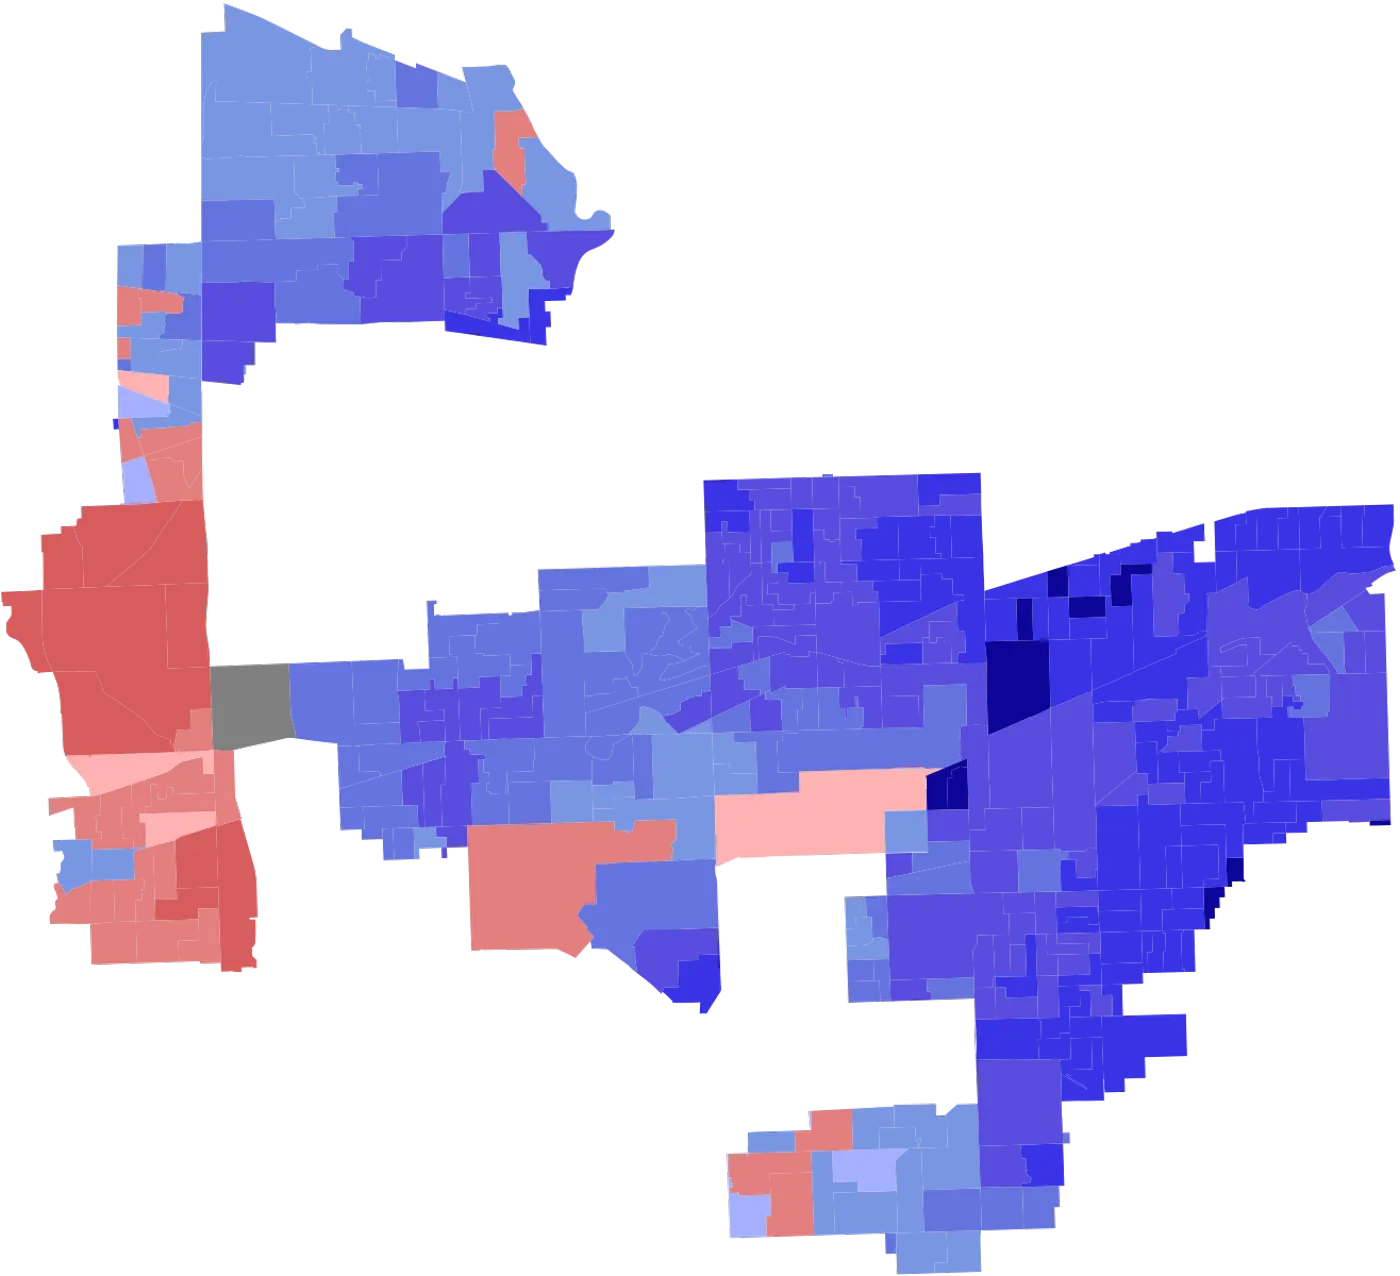
Choropleth of Illinois's 4th Congressional District.
VoterInsight is the forecast I worked on for turnout and results in Illinois’s 4th Congressional District. The work is the whole path from the map of the district to the models, not a single accuracy number at the end.
The problem
A congressional district is a shape on a map before it is a table of votes. IL-4 is not a rectangle, and a forecast that ignores who actually lives inside the line is a forecast about a different place. Turnout and results also do not live in one file. Presidential years, midterms, and the district’s own elections are different tables.
The person it frustrates is anyone trying to read an election from a spreadsheet that never drew the district. It was worth building the pipeline because a model on the wrong geography is a confident answer about the wrong voters. The project is a CS 579 team project, and the point was the full path: collection, preprocessing, feature engineering, and the models.
How I built it
The map starts in R, with sf, dplyr, and ggplot2. The district boundaries are the 2021 adopted Illinois congressional shapefile. Illinois has 17 districts in that file. IL-4 is the filter on district 4, drawn on its own. The precinct layer is the 2022 general congressional precinct shapefile, so the demographics and the results can sit on the same geometry instead of on a county name.
The tables next to that map are the ones in the repo: district election results, presidential election results, and voter turnout with and without the midterms. Those files are why the forecast can tell a presidential year from a midterm instead of averaging them into one turnout.
The models are linear regression, gradient boosting, random forest, and an LSTM. Linear regression is the readable baseline. Gradient boosting and random forest are the tree models on the same features. The LSTM is there because turnout is a sequence, not only a row. The notebooks are Jupyter, with pandas, NumPy, scikit-learn, TensorFlow, and Keras. The spatial write-up is Quarto.
The live write-up of this project credits the GIS work with a 90% gain in predictive accuracy for electoral trend analysis. That figure belongs to the spatial layer, not to a claim that any one of the four models is a finished forecast. The map is what makes the table about IL-4.
Challenges and what I learned
The district line is the constraint. A statewide table would have been easier to model and would have answered a question we did not ask. Filtering the 2021 shapefile to district 4, then bringing in the 2022 precincts, is what keeps the features inside the district. Four models on that table still disagree with each other, which is why the project keeps the regression, the trees, and the LSTM instead of crowning one of them.
Highlights
- GIS spatial analysis in R for district demographics and results.
- GIS spatial analysis credited with a 90% gain in predictive accuracy for electoral trend analysis.